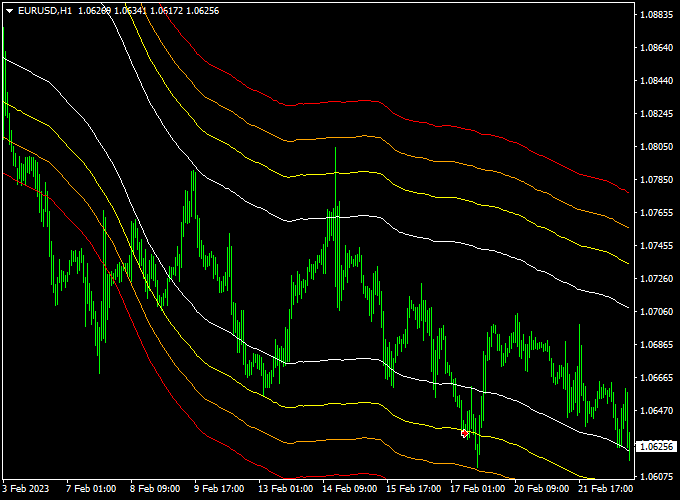
Currency traders will stay in the dark if they fail to obtain information pertaining to price volatility and trend for the intended forex pair.
The one reason why the Bollinger Bands Signals W Metatrader 4 Forex indicator is a great tool to own is hidden in its ability to capture the upper and lower price range for various market sessions.
Key Takeaways
- In order to interpret its signals, the indicator deploys three color schemes using histograms that are on display in the indicator’s window.
- Primarily, the colors of the histograms are lime, yellow and red.
- The absence of volatility in the market is usually marked by the yellow histograms, while the lime histograms indicates contraction in view of a likely breakout to the upside or downside.
- The red histograms suggest a ramping up of volatility in the market and is non-directional.
Feel free to explore the Bollinger Bands Signals W Forex indicator’s different parameters and settings to create your own personalized indicator setup.
Download This MT4 Forex Indicator Free
Download the “Bollinger Bands W.ex4” Metatrader 4 indicator
Bollinger Bands W Signals Forex Indicator Chart (EUR/USD M30 Chart Example)
Here’s an example of how the indicator should look like when loaded onto the Metatrader 4 chart.
Finding Buy and Sell Triggers With The Bollinger Bands W Signals MT4 Indicator
Buy Signal: Go long when price has attained higher highs and the Bollinger Bands W MT4 indicator histograms have turned red following prolonged contraction (lime filed histogram sessions).
Wait for the MACD indicator to print silver histograms above the zero-horizontal level to confirm a bullish trend.
Sell Signal: Go short when price has attained lower lows and the Bollinger Bands W MT4 indicator histograms have turned red following prolonged contraction (lime filed histogram sessions).
Wait for the MACD indicator to print silver histograms below the zero-horizontal level to confirm a bearish trend.
Exit buy trade: Close all buy orders if while a bullish trend is ongoing, the Bollinger Bands W histograms turns lime, while the MACD pops up a silver histogram below the zero level
Exit sell trade: Close all sell orders if while a bearish trend is running, the Bollinger Bands W histograms turns lime, while the MACD pops up a silver histogram above the zero level.
Tips: The Bollinger Bands W indicator cannot be deployed as a standalone technical tool, hence the reason we added the MACD indicator to its setup rules.
Download This Forex Indicator Now
Download the “Bollinger Bands W.ex4” MT4 indicator
Adjustable Parameters
Time frame, bands period, bands shift, bands deviation, min range percent, note 1, width calc period, note 2, show width line.
More Info About This Indicator
Tradable Currency pairs: Any
Trading Platform: MT4
Time frames: M1, M5, M15, M30, H1, H4, D1, W1
Indicator Type: Bollinger Bands
Installation
Copy and paste the indicator in the MT4 indicators data folder.
Then restart the MT4 terminal and attach it to any chart.


