The large time-frame Candlestick Forex indicator for Metatrader 4 reveals buy/sell trends found on the larger time frames.
The indicator appears in the main chart window as large candlesticks wrapped around the smaller candlesticks.
At a glance, you will see the larger market trends, even on smaller time frames.
The candlestick indicator can be useful for high/low breakout trading (see the example more down below).
- A blue colored candlesticks indicates a bullish market trend.
- A red candlestick indicates a bearish market trend.
Tip: Utilize some additional indicators to pinpoint entries within the larger trends.
General Information
- Reveals the larger trends
- Combine with other indicators
- Works for any currency pair
- Does not repaint the candlesticks
- Developed for Metatrader 4
Free Download
Download the large-time-frame-indicator.mq4 indicator file (MT4)
Indicator Chart Example
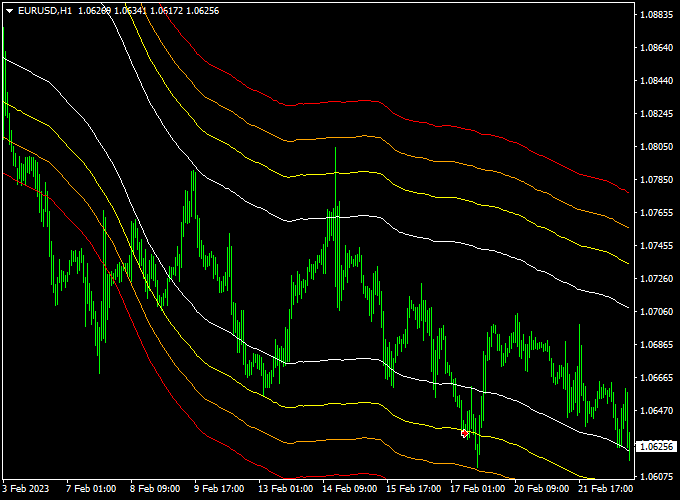
The picture below shows the Large Time-Frame Candlestick indicator attached to the British Pound / U.S. Dollar H1 chart.

How to use this Forex indicator?
This Forex indicator can be used in multiple ways, find an example below:
Buy Signal:
- Open a buy trade when price breaks above the high of the previous day and the previous day’s candlestick is colored blue.
- Place your stop loss below the most recent swing low point.
- Exit the buy trade for a fixed profit target.
Sell Signal:
- Open a sell trade when price breaks below the low of the previous day and the previous day’s candlestick is colored red.
- Place your stop loss above the most recent swing high point.
- Exit the sell trade for a fixed profit target.
How to install the Large Time-Frame Candlestick indicator to the Metatrader 4 platform?
- Download the large-time-frame-indicator.mq4 indicator file here and save it to your computer
- Open your Metatrader 4 platform
- Click on “File” (top menu) and then select “Open Data Folder” from the drop down menu
- Click on “MQL4” and open the “Indicators” folder
- Paste the indicator file in this folder
- Restart Metatrader 4 and you’re ready to start using the indicator
How to edit the indicator?
- Attach the indicator to any trading chart of your preference
- Right click in the chart and select “Indicators List” from the drop down menu
- Select the indicator from the list and click on “Edit”
- Now you can start editing the indicator (Inputs, Colors and Visualization)
- Final step, click on the “OK” button to save the new configuration