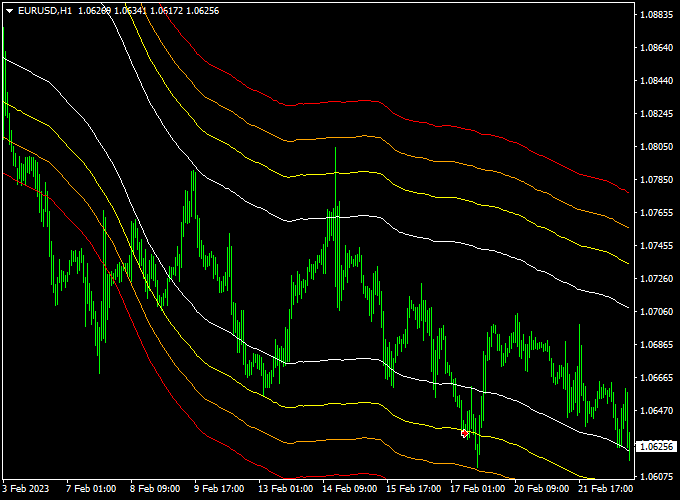
The KG Band Level Range Forex indicator for Metatrader 4 draws solid support and resistance bands on the chart.
It also informs you about current and past market volatility.
The indicator appears in the main screen as purple colored bands that act as support and resistance.
Wider bands indicate more market volatility while narrower bands indicate less market volatility.
General Information
- Support & resistance
- Market volatility
- Works for any trading instrument
- Does not repaint
- Developed for Metatrader 4
Free Download
Download the kg-bs-band-level-range-tt.mq4 indicator file (MT4)
Indicator Chart Example
The picture below shows the KG Band Level Range Forex indicator attached to the Euro / U.S. Dollar 1-hour chart.
How to use this Forex indicator?
This Forex indicator can be used in multiple ways, find an example below:
Buy Signal:
- Open a buy trade when the overall trend is upward and price touches the lower support band.
- Place stop loss below the lower support band.
Sell Signal:
- Open a sell trade when the overall trend is downward and price touches the upper resistance band.
- Place stop loss above the upper resistance.
How to install the KG Band Level Range indicator to the Metatrader 4 platform?
- Download the kg-bs-band-level-range-tt.mq4 indicator file here and save it to your computer
- Open your Metatrader 4 platform
- Click on “File” (top menu) and then select “Open Data Folder” from the drop down menu
- Click on “MQL4” and open the “Indicators” folder
- Paste the indicator file in this folder
- Restart Metatrader 4 and you’re ready to start using the indicator
How to edit the indicator?
- Attach the indicator to any trading chart of your preference
- Right click in the chart and select “Indicators List” from the drop down menu
- Select the indicator from the list and click on “Edit”
- Now you can start editing the indicator (Inputs, Colors and Visualization)
- Final step, click on the “OK” button to save the new configuration


