The Multi Time Frame Bar Close Forex indicator for Metatrader 4 draws the bar close for multiple time frames on a single chart.
In essence, it analyzes different time frames for bar close prices and plots the outcome on a single chart as horizontal lines.
The indicator is versatile and can be useful for stop loss placement, take profit and price breakouts.
You can deploy it on any currency pair of your preference.
General Information
- Prints MTF bar close prices
- Versatile indicator
- Works for any Forex pair
- Does not repaint
- Developed for Metatrader 4
Free Download
Download the klines-indicator.mq4 indicator file (MT4)
Indicator Chart Example
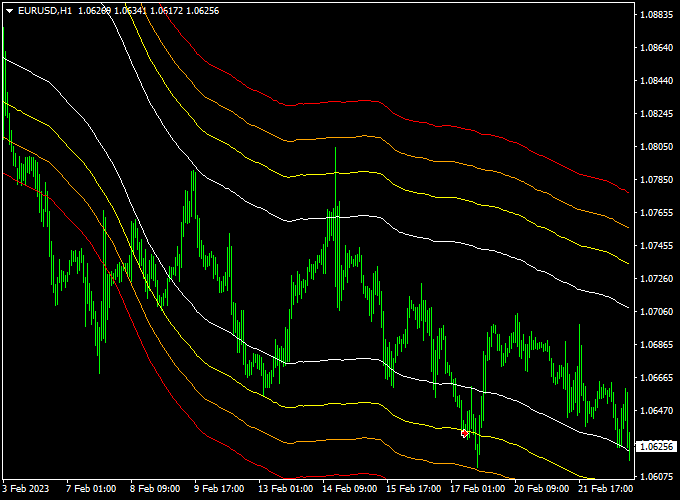
The picture below shows the Multi Time Frame Bar Close indicator attached to the British Pound / U.S. Dollar H1 chart.

How to use this Forex indicator?
This Forex indicator can be used in multiple ways, find an example below:
Buy Signal:
- Open a buy order when price closes above the highest bar close bar and the overall trend is upward.
- Place a stop loss 3 pips below swing support.
- Exit the buy trade for a fixed take profit target.
Sell Signal:
- Open a sell order when price closes below the lowest bar close bar and the overall trend is upward.
- Place a stop loss 3 pips above swing resistance.
- Exit the sell trade for a fixed take profit target.
How to install the Multi Time Frame Bar Close Forex indicator to the Metatrader 4 platform?
- Download the klines-indicator.mq4 indicator file here and save it to your computer
- Open your Metatrader 4 platform
- Click on “File” (top menu) and then select “Open Data Folder” from the drop down menu
- Click on “MQL4” and open the “Indicators” folder
- Paste the indicator file in this folder
- Restart Metatrader 4 and you’re ready to start using the indicator
How to edit the indicator?
- Attach the indicator to any trading chart of your preference
- Right click in the chart and select “Indicators List” from the drop down menu
- Select the indicator from the list and click on “Edit”
- Now you can start editing the indicator (Inputs, Colors and Visualization)
- Final step, click on the “OK” button to save the new configuration