The Trend Candlestick Forex Signals Dashboard indicator for Metatrader 4 measures and displays the trend for 9 time frames.
The indicator gets displayed as a trend dashboard in the upper left part of the main screen.
Buying and selling with this indicator is easy and straightforward.
For scalping and day trading purposes, the indicator tends to deliver the best results during the London and American trading session.
Free Download
Download the Trend Candlestick Forex Signals Dashboard.ex4 indicator file (MT4)
Indicator Chart Example
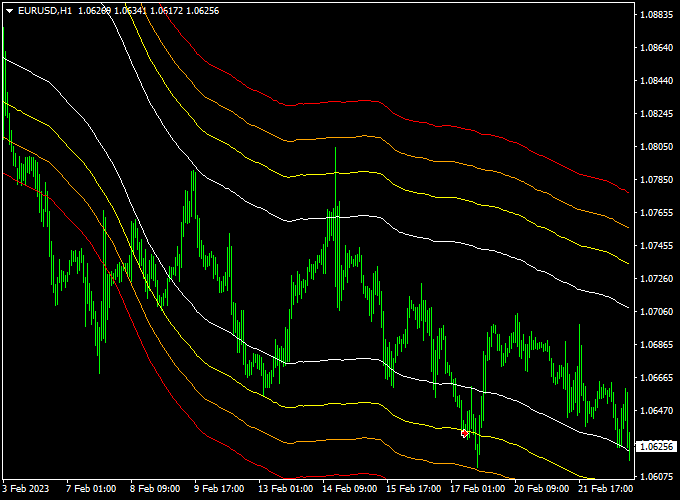
The picture below shows the Trend Candlestick Forex Signals Dashboard indicator attached to the EUR/USD H1 chart.

How to use the Trend Candlestick Forex Signals Dashboard indicator?
The indicator can be used in multiple ways, find an example below:
Buy Signal:
- Open a buy trade when all trend candlestick bars are colored green.
- Place your stop loss below short-term support.
- Exit the buy trade for a fixed take profit target or wait for an opposite trading signal.
Sell Signal:
- Open a sell trade when all trend candlestick bars are colored red.
- Place your stop loss above short-term resistance.
- Exit the sell trade for a fixed take profit target or wait for an opposite trading signal.
In case of mixed green and red bars, stand aside.
How to install the Trend Candlestick Forex Signals Dashboard indicator to the Metatrader 4 platform?
- Download the Trend Candlestick Forex Signals Dashboard.ex4 indicator file here and save it to your computer
- Open your Metatrader 4 platform
- Click on “File” (top menu) and then select “Open Data Folder” from the drop down menu
- Click on “MQL4” and open the “Indicators” folder
- Paste the indicator file in this folder
- Restart Metatrader 4 and you’re ready to start using the indicator
How to edit the indicator?
- Attach the indicator to any trading chart of your preference
- Right click in the chart and select “Indicators List” from the drop down menu
- Select the indicator from the list and click on “Edit”
- Now you can start editing the indicator (Inputs, Colors and Visualization)
- Final step, click on the “OK” button to save the new configuration